12 projects - sundash
My 12 projects plan continues to bear fruit. In February, I dipped my toes into the world of IoT.
Background. A few years ago I had solar panels installed on the house. At the time, I decided to build a dashboard to show eink data. I bought the hardware - a raspberry pi and an eink panel, but I never really got further than running sample code to show an image on screen.
Fast forward to 2025, and my 12 projects plan.
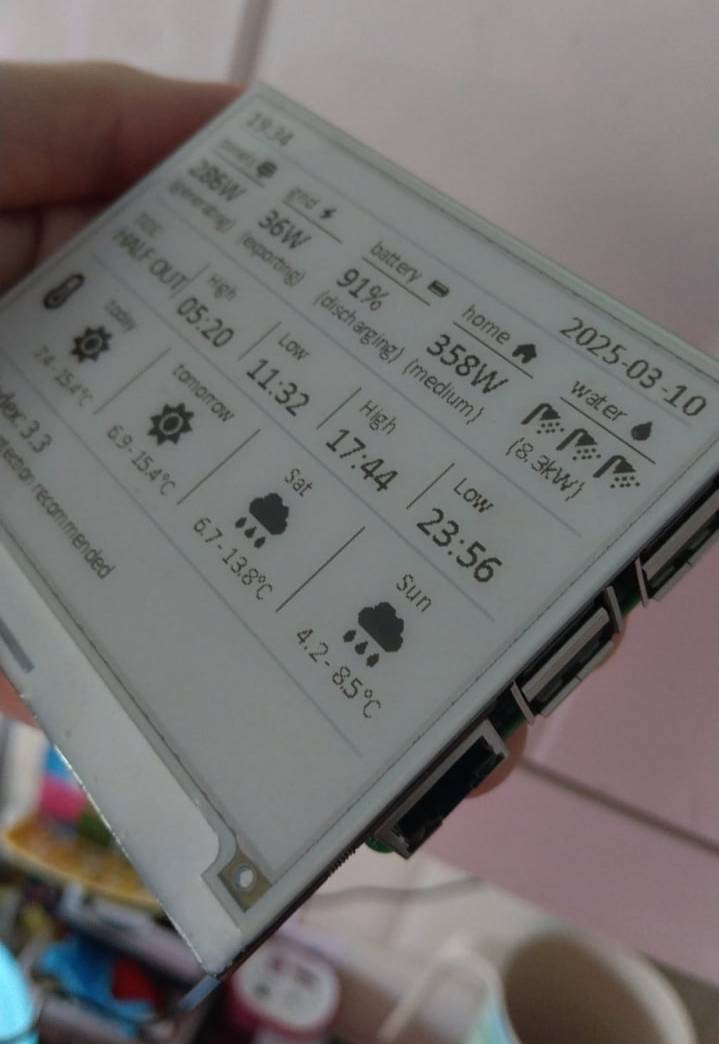
I decided to finally realise the dream of having a solar dashboard in the kitchen, showing stats and other data.
My setup is a 4.9kW panel array with a battery pack, and solar diverter (my energi eddi). The battery seemed important when I first got the system, as feed in tarriffs didnt exist in ireland, so any electricity you sent back to the grid was money lost. It was in a user’s best interest to charge a battery and keep as much of the generated power as possible.
However, about 2 years back the government finally brought in feedin tarriffs. Now you get paid for every kWh you send back to the grid, and so trying to cling on to every kWh seems pointless.
But I digress - bacl to the projcect
First step was accessing the solar panel data. I did this by piggybacking on someone elses work on github to poll the inverter manufacturer’s website / API and pull data about my usage. This gave me pages of json data which I was able to digest.
Next, I wrote a rendereding system in python that would draw rows of data on the screen.
Once I had my solar data in, I added calls to the MyEnergi Eddi API to find out how much hot water had been generated.
I had some spare space under all that, so I added tide times for our area, and made them easy for kids to read by showing not just the time but also whether or not the tide was “in” or “out” using emoji for swimming / dog walking.
I’m quite happy with the result. It’s probably the most useful of all the projects I’ve done so far this year.